Landscape analysis
The Landscape class is the core code unit of PyLandStats and is used to compute the metrics over a given landscape raster. It can be instantiated as follows:
-
Landscape.__init__(landscape, res=None, nodata=None, transform=None, **kwargs)[source]¶ Parameters: - landscape (np.ndarray or str, file object or pathlib.Path object) – A landscape array with pixel values corresponding to a set of land use/land cover classes, or a filename or URL, a file object opened in binary (‘rb’) mode, or a Path object. If not a np.ndarray, landscape will be passed to rasterio.open
- res (tuple, optional) – The (x, y) resolution of the dataset. Required if landscape is a np.ndarray
- nodata (int, optional) – Value to be assigned to pixels with no data. It will be set to 0 if landscape is a np.ndarray
- transform (affine.Affine, optional) – Transformation from pixel coordinates to coordinate reference system. If landscape is a path to a GeoTiff, this argument will be ignored and extracted from the raster’s metadata instead
- **kwargs (optional) – Keyword arguments to be passed to rasterio.open. Ignored if landscape is an np.ndarray
List of implemented metrics
The metrics of PyLandStats are computed according to its definitions in FRAGSTATS.
The notation for the metrics below is as follows:
- the letters with suffixes
 respectively represent the area, perimeter, and distance to the nearest neighboring patch of the same class of the patch
  of class
  .
. - the letters with suffixes
 respectively represent the total edge between and number of pixel adjacencies between classes and
- the capital letters
 respectively represent the total area, total number of patches and total edge of the landscape
Like FRAGSTATS, PyLandStats features six distribution-statistics metrics for each patch-level metric, which consist in a statistical aggregation of the values computed for each patch of a class or the whole landscape:
- the mean, which can be computed by adding a _mn suffix to the method name, e.g., area_mn
- the area-weighted mean, which can be computed by adding a _am suffix to the method name, e.g., area_am
- the median, which can be computed by adding a _md suffix to the method name, e.g., area_md
- the range, which can be computed by adding a _ra suffix to the method name, e.g., area_ra
- the standard deviation, which can be computed by adding a _sd suffix to the method name, e.g., area_sd
- the coefficient of variation, which can be computed by adding a _cv suffix to the method name, e.g., area_cv
note that the distribution-statistics metrics do not appear in the documentation below.
See the FRAGSTATS documentation for more information.
Patch-level metrics
Area, density, edge
-
Landscape.area(class_val=None, hectares=True)[source]¶ The area of each patch of the landscape
![AREA = a_{i,j} \quad [hec] \; or \; [m]](_images/math/6a4323c8fddcf486ff379585bff821943998604a.png)
Parameters: - class_val (int, optional) – If provided, the metric will be computed for the corresponding class only, otherwise it will be computed for all the classes of the landscape
- hectares (bool, default True) – Whether the landscape area should be converted to hectares (tends to yield more legible values for the metric)
Returns: AREA – AREA > 0, without limit
Return type: pd.Series if class_val is provided, pd.DataFrame otherwise
-
Landscape.perimeter(class_val=None)[source]¶ The perimeter of each patch of the landscape
![PERIM = p_{i,j} \quad [m]](_images/math/f9b1306b2b1a12b051c90b64dcde952f25b2cfb3.png)
Parameters: class_val (int, optional) – If provided, the metric will be computed for the corresponding class only, otherwise it will be computed for all the classes of the landscape Returns: PERIM – PERIM > 0, without limit Return type: pd.Series if class_val is provided, pd.DataFrame otherwise
Shape
-
Landscape.perimeter_area_ratio(class_val=None, hectares=True)[source]¶ The ratio between the perimeter and area of each patch of the landscape. Measures shape complexity, however it varies with the size of the patch, e.g, for the same shape, larger patches will have a smaller perimeter-area ratio.
![PARA = \frac{p_{i,j}}{a_{i,j}} \quad [m/hec] \; or \; [m/m^2]](_images/math/a65967095143bfd0ee32f396c3663e76ebd106e5.png)
Parameters: - class_val (int, optional) – If provided, the metric will be computed for the corresponding class only, otherwise it will be computed for all the classes of the landscape
- hectares (bool, default True) – Whether the area should be converted to hectares (tends to yield more legible values for the metric)
Returns: PARA – PARA > 0, without limit
Return type: pd.Series if class_val is provided, pd.DataFrame otherwise
-
Landscape.shape_index(class_val=None)[source]¶ A measure of shape complexity, similar to the perimeter-area ratio, but correcting for its size problem by adjusting for a standard square shape.
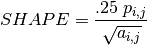
Parameters: class_val (int, optional) – If provided, the metric will be computed for the corresponding class only, otherwise it will be computed for all the classes of the landscape Returns: SHAPE – SHAPE >= 1, without limit ; SHAPE equals 1 when the patch is maximally compact, and increases without limit as patch shape becomes more regular Return type: pd.Series if class_val is provided, pd.DataFrame otherwise
-
Landscape.fractal_dimension(class_val=None)[source]¶ A measure of shape complexity appropriate across a wide range of patch sizes
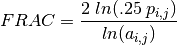
Parameters: class_val (int, optional) – If provided, the metric will be computed for the corresponding class only, otherwise it will be computed for all the classes of the landscape Returns: FRAC – 1 <= FRAC <=2 ; for a two-dimensional patch, FRAC approaches 1 for very simple shapes such as squares, and approaches 2 for complex plane-filling shapes Return type: pd.Series if class_val is provided, pd.DataFrame otherwise
Aggregation
-
Landscape.euclidean_nearest_neighbor(class_val=None)[source]¶ Distance to the nearest neighboring patch of the same class based on the shortest edge-to-edge distance
![ENN = h_{i,j} \quad [m]](_images/math/d53661dd5539f6efd3d8bd7e3b013f2f38baabc6.png)
Parameters: class_val (int, optional) – If provided, the metric will be computed for the corresponding class only, otherwise it will be computed for all the classes of the landscape Returns: ENN – ENN > 0, without limit ; ENN approaches 0 as the distance to the nearest neighbors decreases Return type: numeric
Class-level and landscape-level metrics
Area, density, edge
-
Landscape.total_area(class_val=None, hectares=True)[source]¶ Total area. If class_val is provided, the metric is computed at the class level as in:
![TA_i = \sum_{j=1}^{n_i} a_{i,j} \quad [hec] \; or \; [m] \quad
(class \; i)](_images/math/5d65f3ff10d7755fa53f666e837204a907198279.png)
otherwise, the metric is computed at the landscape level as in:
![TA = A \quad [hec] \; or \; [m] \quad (landscape)](_images/math/014894f6b6bb1b6b6bae85b5485a91eb2b8b60aa.png)
Parameters: - class_val (int, optional) – If provided, the metric will be computed at the level of the corresponding class, otherwise it will be computed at the landscape level
- hectares (bool, default True) – Whether the area should be converted to hectares (tends to yield more legible values for the metric)
Returns: TA
Return type: numeric
-
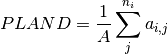
Landscape.proportion_of_landscape(class_val, percent=True)[source]¶ Measures the proportional abundance of a particular class within the landscape. It is computed at the class level as in:
Parameters: - class_val (int) – Class for which the metric should be computed
- percent (bool, default True) – Whether the index should be expressed as proportion or converted to percentage. If True, this method returns FRAGSTATS’ percentage of landscape (PLAND)
Returns: PLAND – 0 < PLAND <= 100 ; PLAND approaches 0 when the occurrence of the corresponding class becomes increasingly rare, and approaches 100 when the entire landscape consists of a single patch of such class.
Return type: numeric
-
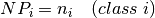
Landscape.number_of_patches(class_val=None)[source]¶ Number of patches. If class_val is provided, the metric is computed at the class level as in:
otherwise, the metric is computed at the landscape level as in:
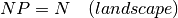
Parameters: class_val (int, optional) – If provided, the metric will be computed at the level of the corresponding class, otherwise it will be computed at the landscape level Returns: NP – NP >= 1, without limit Return type: int
-
Landscape.patch_density(class_val=None, percent=True, hectares=True)[source]¶ Density of class patches, which is arguably more useful than the number of patches since it facilitates comparison among landscapes of different sizes. If class_val is provided, the metric is computed at the class level as in:
![PD_i = \frac{n_i}{A} \quad [1/hec] \; or \; [1/m^2] \quad (class
\; i)](_images/math/a73d87e5958d45bfd8a879059d9c71b736ec0435.png)
otherwise, the metric is computed at the landscape level as in:
![PD = \frac{N}{A} \quad [1/hec] \; or \; [1/m^2] \quad (landscape)](_images/math/d0460d4a42b4b013667cb686878446e82cdffd54.png)
Parameters: - class_val (int, optional) – If provided, the metric will be computed at the level of the corresponding class, otherwise it will be computed at the landscape level
- percent (bool, default True) – Whether the index should be expressed as proportion or converted to percentage
- hectares (bool, default True) – Whether the landscape area should be converted to hectares (tends to yield more legible values for the metric)
Returns: PD – PD > 0, constrained by cell size ; maximum PD is attained when every cell is a separate patch
Return type: numeric
-
Landscape.largest_patch_index(class_val=None, percent=True)[source]¶ The proportion of total landscape comprised by the largest patch. If class_val is provided, the metric is computed at the class level as in:
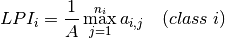
otherwise, the metric is computed at the landscape level as in:
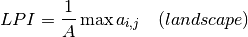
Parameters: - class_val (int, optional) – If provided, the metric will be computed at the level of the corresponding class, otherwise it will be computed at the landscape level
- percent (bool, default True) – Whether the index should be expressed as proportion or converted to percentage
Returns: LPI – 0 < LPI <= 100 (or 0 < LPI <= 1 if percent argument is False) ; LPI approaches 0 when the largest patch of the corresponding class is increasingly small, and approaches its maximum value when such largest patch comprises the totality of the landscape
Return type: numeric
-
Landscape.total_edge(class_val=None, count_boundary=False)[source]¶ Measure of the total edge length. If class_val is provided, the metric is computed at the class level as in:
![TE_i = \sum_{k=1}^{m} e_{i,k} \quad [m] \quad (class \; i)](_images/math/5838be92bd66c65da4d8ef0ead7f8d20d1043a1b.png)
otherwise, the metric is computed at the landscape level as in:
![TE = E \quad [m] \quad (landscape)](_images/math/342f90be533e48ae20f8aa4632397abbe0a5d77f.png)
Parameters: - class_val (int, optional) – If provided, the metric will be computed at the level of the corresponding class, otherwise it will be computed at the landscape level
- count_boundary (bool, default False) – Whether the boundary of the landscape should be included in the total edge length
Returns: TE – TE >= 0 ; TE equals 0 when the entire landscape and its border consist of the corresponding class
Return type: numeric
-
Landscape.edge_density(class_val=None, count_boundary=False, hectares=True)[source]¶ Measure of edge length per area unit, which facilitates comparison among landscapes of different sizes. If class_val is provided, the metric is computed at the class level as in:
![ED_i = \frac{1}{A} \sum_{k=1}^{m} e_{i,k} \quad [m/hec] \; or
\; [m/m^2] \quad (class \; i)](_images/math/b22535c5d11953138ce4949b1fe530bcdec7102b.png)
otherwise, the metric is computed at the landscape level as in:
![ED = \frac{E}{A} \quad [m/hec] \; or \; [m/m^2] \quad (landscape)](_images/math/75ac9001229aa3244dc0b7658e4ad34fdf7f87d6.png)
Parameters: - class_val (int, optional) – If provided, the metric will be computed at the level of the corresponding class, otherwise it will be computed at the landscape level
- count_boundary (bool, default False) – Whether the boundary of the landscape should be considered
- hectares (bool, default True) – Whether the landscape area should be converted to hectares (tends to yield more legible values for the metric)
Returns: ED – ED >= 0, without limit ; ED equals 0 when the entire landscape and its border consist of the corresponding patch class.
Return type: numeric
Aggregation
-
Landscape.landscape_shape_index(class_val=None)[source]¶ Measure of class aggregation that provides a standardized measure of edginess that adjusts for the size of the landscape. If class_val is provided, the metric is computed at the class level as in:
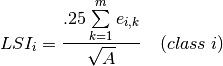
otherwise, the metric is computed at the landscape level as in:
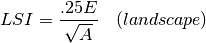
Parameters: class_val (int, optional) – If provided, the metric will be computed at the level of the corresponding class, otherwise it will be computed at the landscape level Returns: LSI – LSI >=1 ; LSI equals 1 when the entire landscape consists of a single patch of the corresponding class, and increases without limit as the patches of such class become more disaggregated. Return type: float
-
Landscape.effective_mesh_size(class_val=None, hectares=True)[source]¶ Measure of aggregation based on the cumulative patch size distribution. If class_val is provided, the metric is computed at the class level as in:
![MESH_i = \frac{1}{A} \sum_{j=1}^{n_i} a_{i,j}^2 \quad [m] \quad
(class \; i)](_images/math/99b3395fcfb1d6ee40a4984e0a88a0d3757317f3.png)
otherwise, the metric is computed at the landscape level as in:
![MESH = \frac{1}{A} \sum_{i=1}^{m} \sum_{j=1}^{n_i} a_{i,j}^2
\quad [m] \quad (landscape)](_images/math/92a2ad6dcd5e0e68835ec51742b417da84a602b9.png)
Parameters: - class_val (int, optional) – If provided, the metric will be computed at the level of the corresponding class, otherwise it will be computed at the landscape level
- hectares (bool, default True) – Whether the landscape area should be converted to hectares (tends to yield more legible values for the metric)
Returns: mesh – cell_area / A <= MESH <= A
Return type: float
Landscape-level metrics
Contagion, interspersion
-
Landscape.contagion(percent=True)[source]¶ Measure of aggregation that measures the probability that two random adjacent cells belong to the same class. It is computed at the landscape level as in:
![CONTAG = 1 + \frac{
\sum \limits_{i=1}^{m} \sum \limits_{k=1}^{m} \Bigg[
P_i \frac{g_{i,k}}{\sum \limits_{k=1}^{m} g_{i,k}}
\Bigg] \Bigg[ ln \Bigg(
P_i \frac{g_{i,k}}{\sum \limits_{k=1}^{m} g_{i,k}}
\Bigg) \Bigg]}{2 ln(m)}](_images/math/a69b2e0588b085e47deb6fdb733737184cf41a16.png)
Parameters: percent (bool, default True) – Whether the index should be expressed as proportion or converted to percentage Returns: CONTAG – 0 < CONTAG <= 100 ; CONTAG approaches 0 when the classes are maximally disaggregated (i.e., every cell is a patch of a different class) and interspersed (i.e., equal proportions of all pairwise adjacencies), and approaches its maximum when the landscape consists of a single patch. Return type: float
-
Landscape.shannon_diversity_index()[source]¶ Measure of diversity that reflects the number of classes present in the landscape as well as the relative abundance of each class. It is computed at the landscape level as in:
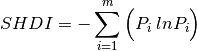
Returns: SHDI – SHDI >= 0 ; SHDI approaches 0 when the entire landscape consists of a single patch, and increases as the number of classes increases and/or the proportional distribution of area among classes becomes more equitable. Return type: float
Computing metrics data frames
-
Landscape.compute_patch_metrics_df(metrics=None, metrics_kws=None)[source]¶ Computes the patch-level metrics
Parameters: - metrics (list-like, optional) – A list-like of strings with the names of the metrics that should be computed. If None, all the implemented patch-level metrics will be computed.
- metrics_kws (dict, default None) – Dictionary mapping the keyword arguments (values) that should be passed to each metric method (key), e.g., to compute area in meters instead of hectares, metric_kws should map the string ‘area’ (method name) to {‘hectares’: False}. If None, each metric will be computed according to FRAGSTATS defaults.
Returns: df – Dataframe with the values computed for each patch (index) and metric (columns)
Return type: pd.DataFrame
-
Landscape.compute_class_metrics_df(metrics=None, classes=None, metrics_kws=None)[source]¶ Computes the class-level metrics
Parameters: - metrics (list-like, optional) – A list-like of strings with the names of the metrics that should be computed. If None, all the implemented class-level metrics will be computed.
- classes (list-like, optional) – A list-like of ints or strings with the class values that should be considered in the context of this analysis case
- metrics_kws (dict, optional) – Dictionary mapping the keyword arguments (values) that should be passed to each metric method (key), e.g., to exclude the boundary from the computation of total_edge, metric_kws should map the string ‘total_edge’ (method name) to {‘count_boundary’: False}. If None, each metric will be computed according to FRAGSTATS defaults.
Returns: df – Dataframe with the values computed for each class (index) and metric (columns)
Return type: pd.DataFrame
-
Landscape.compute_landscape_metrics_df(metrics=None, metrics_kws=None)[source]¶ Computes the landscape-level metrics
Parameters: - metrics (list-like, optional) – A list-like of strings with the names of the metrics that should be computed. If None, all the implemented landscape-level metrics will be computed.
- metrics_kws (dict, optional) – Dictionary mapping the keyword arguments (values) that should be passed to each metric method (key), e.g., to exclude the boundary from the computation of total_edge, metric_kws should map the string ‘total_edge’ (method name) to {‘count_boundary’: False}. If None, each metric will be computed according to FRAGSTATS defaults.
Returns: df – Dataframe with the values computed at the landscape level (one row only) for each metric (columns)
Return type: pd.DataFrame
Plotting landscape raster
-
Landscape.plot_landscape(cmap=None, ax=None, legend=False, figsize=None, **show_kws)[source]¶ Plots the landscape with a categorical legend by means of rasterio.plot.show
Parameters: - cmap (str or ~matplotlib.colors.Colormap, optional) – A Colormap instance
- ax (axis object, optional) – Plot in given axis; if None creates a new figure
- legend (bool, optional) – If
True, display the legend - figsize (tuple of two numeric types, optional) – Size of the figure to create. Ignored if axis ax is provided
- **show_kws (optional) – Keyword arguments to be passed to rasterio.plot.show
Returns: ax – axis with plot data
Return type: matplotlib axis